Written By: Prevail Strategies
Hello again – we hope you are having a great start to your February. Prevail is pleased to bring you another edition of our monthly communication where we discuss current developments, macro trends, expectations, how we interpret the state of the markets, and other topics.
We want to make sure we keep you up-to-date and informed on topics in the market that are important to you, and we hope you find this information useful. If you have any questions, please contact your Investment Advisor Representative.
Summary Overview
Economic growth reaccelerated at the end of 2021 and should continue to be very strong as reopening resumes and companies try to rebuild inventories.
As we move further into 2022, the real output looks set to exceed its pre-pandemic growth path, indicating a full recovery.
The economy in 2022 should be much healthier than in the last two years. World GDP has recovered from the worst of the effects of the pandemic. Some of the economies hurt the worst by the virus in 2020 and early 2021 have recently rebounded – with others expected to follow soon.
Inflation and Supply Chains
The January CPI print came in at a red-hot +7.5% Y/Y – economists forecasted a 7.3% increase. Despite the higher-than-anticipated print, the market was not rattled because investors were already expecting a fairly hot CPI print.
The combination of supply chain woes, surging demand, heavy government spending, and extremely accommodative monetary policy have contributed to a surge in inflation that is nearly impossible to not notice. Words like “supply chain,” “logistics,” and “inflation” appeared in 71% of Q4 earnings calls, which is up 39.2% from the previous year.
Many supply chain problems figure to ease over the course of the year – though how quickly and how much they improve remain to be seen. Delays in manufacturing and shipping caused by omicron should end fairly quickly this winter and lead to a burst of activity in the spring.
Oil
The price of oil continues to rise based on worries about a possible invasion of Ukraine, anticipated cold weather, and mounting output concerns surrounding OPEC+.
US Implied Oil Demand – a forward-looking indicator – hit an all-time high last week. The implied oil market deficit this year is -1.1 million barrels/day compared to the forecasted demand of 1.2-1.4 million barrel/day surplus
What’s most important about this number is that peak season for oil demand is months away. If demand continues to remain strong, expect the price of oil to keep climbing.
Rate Hikes
Based on the February CPI print, we expect the Fed to raise rates by 50 bps in March, not 25 bps. If the Fed raises rates by 25 bps, then we expect another quick subsequent 25 bps rate hike in May. Despite the recent pullback in equity valuations – which we believe was necessary given the unprecedented growth over the last few years – we expect more market volatility when the Fed raises interest rates in March, especially if they raise rates by 50 bps.
Despite all the chatter surrounding the Fed, we do not believe the market has appropriately “priced in” the coming rate hikes and we see this as an opportunity to capitalize on the expected volatility.
Going Forward – Volatility Suits Active Management
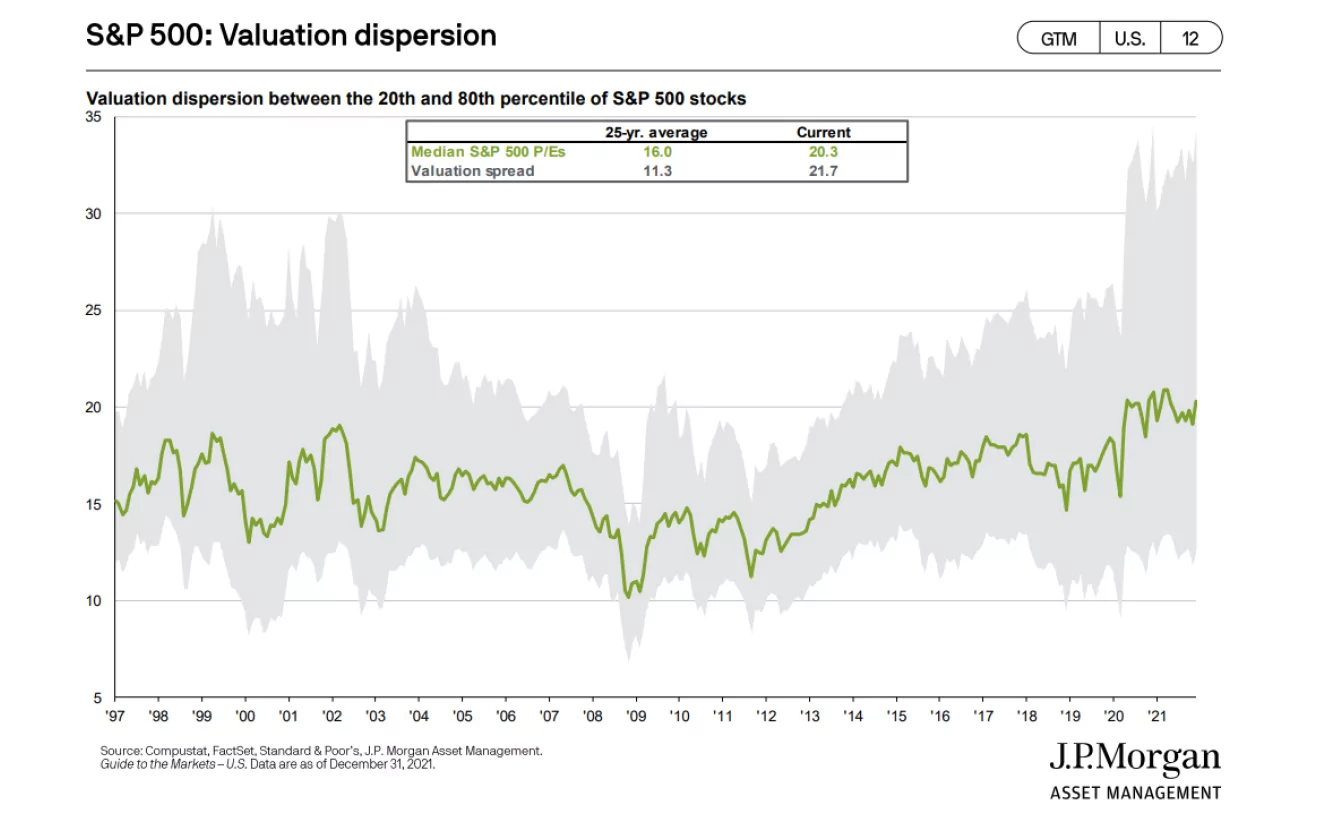
S&P valuation dispersion (shown in the graphic) is currently markedly higher than the 25-year average – this wide dispersion in valuations points to an opportunity for active management to outperform.

Given the substantial growth, markets have had already in this economic cycle, we believe most growth will now be driven by quality firms with sound fundamentals and the ability to generate positive earnings and cash flow growth. Being active in our models gives us the opportunity to ride the waves of volatility by increasing our portfolio turnover, compounding small gains in individual names, and keeping our capital moving so we can stay out in front of the market.
Disclosure
Past performance is not indicative of future results. This material is not financial advice or an offer to sell any product. The information contained herein should not be considered a recommendation to purchase or sell any particular security. Forward-looking statements cannot be guaranteed.
This commentary offers generalized research, not personalized investment advice. It is for informational purposes only and does not constitute a complete description of our investment services or performance. Nothing in this commentary should be interpreted to state or imply that past results are an indication of future investment returns. All investments involve risk and unless otherwise stated, are not guaranteed. Be sure to consult with an investment & tax professional before implementing any investment strategy. Investing involves risk. Principal loss is possible.
The S&P 500® is widely regarded as the best single gauge of large-cap U.S. equities. There is over USD 11.2 trillion indexed or benchmarked to the index, with indexed assets comprising approximately USD 4.6 trillion of this total. The index includes 500 leading companies and covers approximately 80% of available market capitalization.
The Nasdaq Composite Index measures all Nasdaq domestic and international based common type stocks listed on The Nasdaq Stock Market. To be eligible for inclusion in the Index, the security’s U.S. listing must be exclusively on The Nasdaq Stock Market (unless the security was dually listed on another U.S. market prior to January 1, 2004 and has continuously maintained such listing). The security types eligible for the Index include common stocks, ordinary shares, ADRs, shares of beneficial interest or limited partnership interests and tracking stocks. Security types not included in the Index are closed-end funds, convertible debentures, exchange-traded funds, preferred stocks, rights, warrants, units, and other derivative securities.
The Dow Jones Industrial Average® (The Dow®), is a price-weighted measure of 30 U.S. blue-chip companies. The index covers all industries except transportation and utilities.
The Russell 2000® Index measures the performance of the small-cap segment of the US equity universe. The Russell 2000® Index is a subset of the Russell 3000® Index representing approximately 10% of the total market capitalization of that index. It includes approximately 2,000 of the smallest securities based on a combination of their market cap and current index membership. The Russell 2000® is constructed to provide a comprehensive and unbiased small-cap barometer and is completely reconstituted annually to ensure larger stocks do not distort the performance and characteristics of the true small-cap opportunity set.
The MSCI EAFE Index is an equity index that captures large and mid-cap representation across 21 Developed Markets countries*around the world, excluding the US and Canada. With 902 constituents, the index covers approximately 85% of the free float-adjusted market capitalization in each country.
The MSCI Emerging Markets Index captures large and mid-cap representation across 26 Emerging Markets (EM) countries*. With 1,387 constituents, the index covers approximately 85% of the free float-adjusted market capitalization in each country.
Year To Date Prevail Performance Returns are estimated from using end-of-month performance from select client statements. The returns are not audited and do not indicate performance for all clients invested in one of these portfolios. Timing of market entry will affect client returns and not all clients will experience the estimated returns listed above. Returns do not indicate future performance.
The Bloomberg Barclays U.S. Aggregate Bond Index is a broad-based benchmark that measures the investment grade, U.S. dollar-denominated, fixed-rate taxable bond market. This includes Treasuries, government-related and corporate securities, mortgage-backed securities, asset-backed securities, and collateralized mortgage-backed securities.
Advisory services are offered through Prevail Innovative Wealth Advisors, LLC, a Registered Investment Adviser registered with the State of Missouri, Kansas, and Texas. Registration does not imply a certain level or skill or training. More information about the registered investment advisor, its investment strategies, and objectives, is included in the firm’s Form ADV Part 2, which can be obtained, at no charge, by calling 913295-9500. Prevail Innovative Wealth Advisors, LLC


